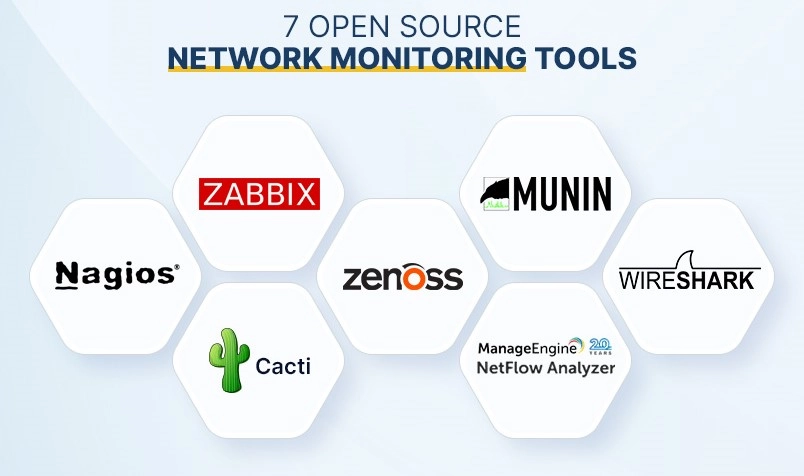
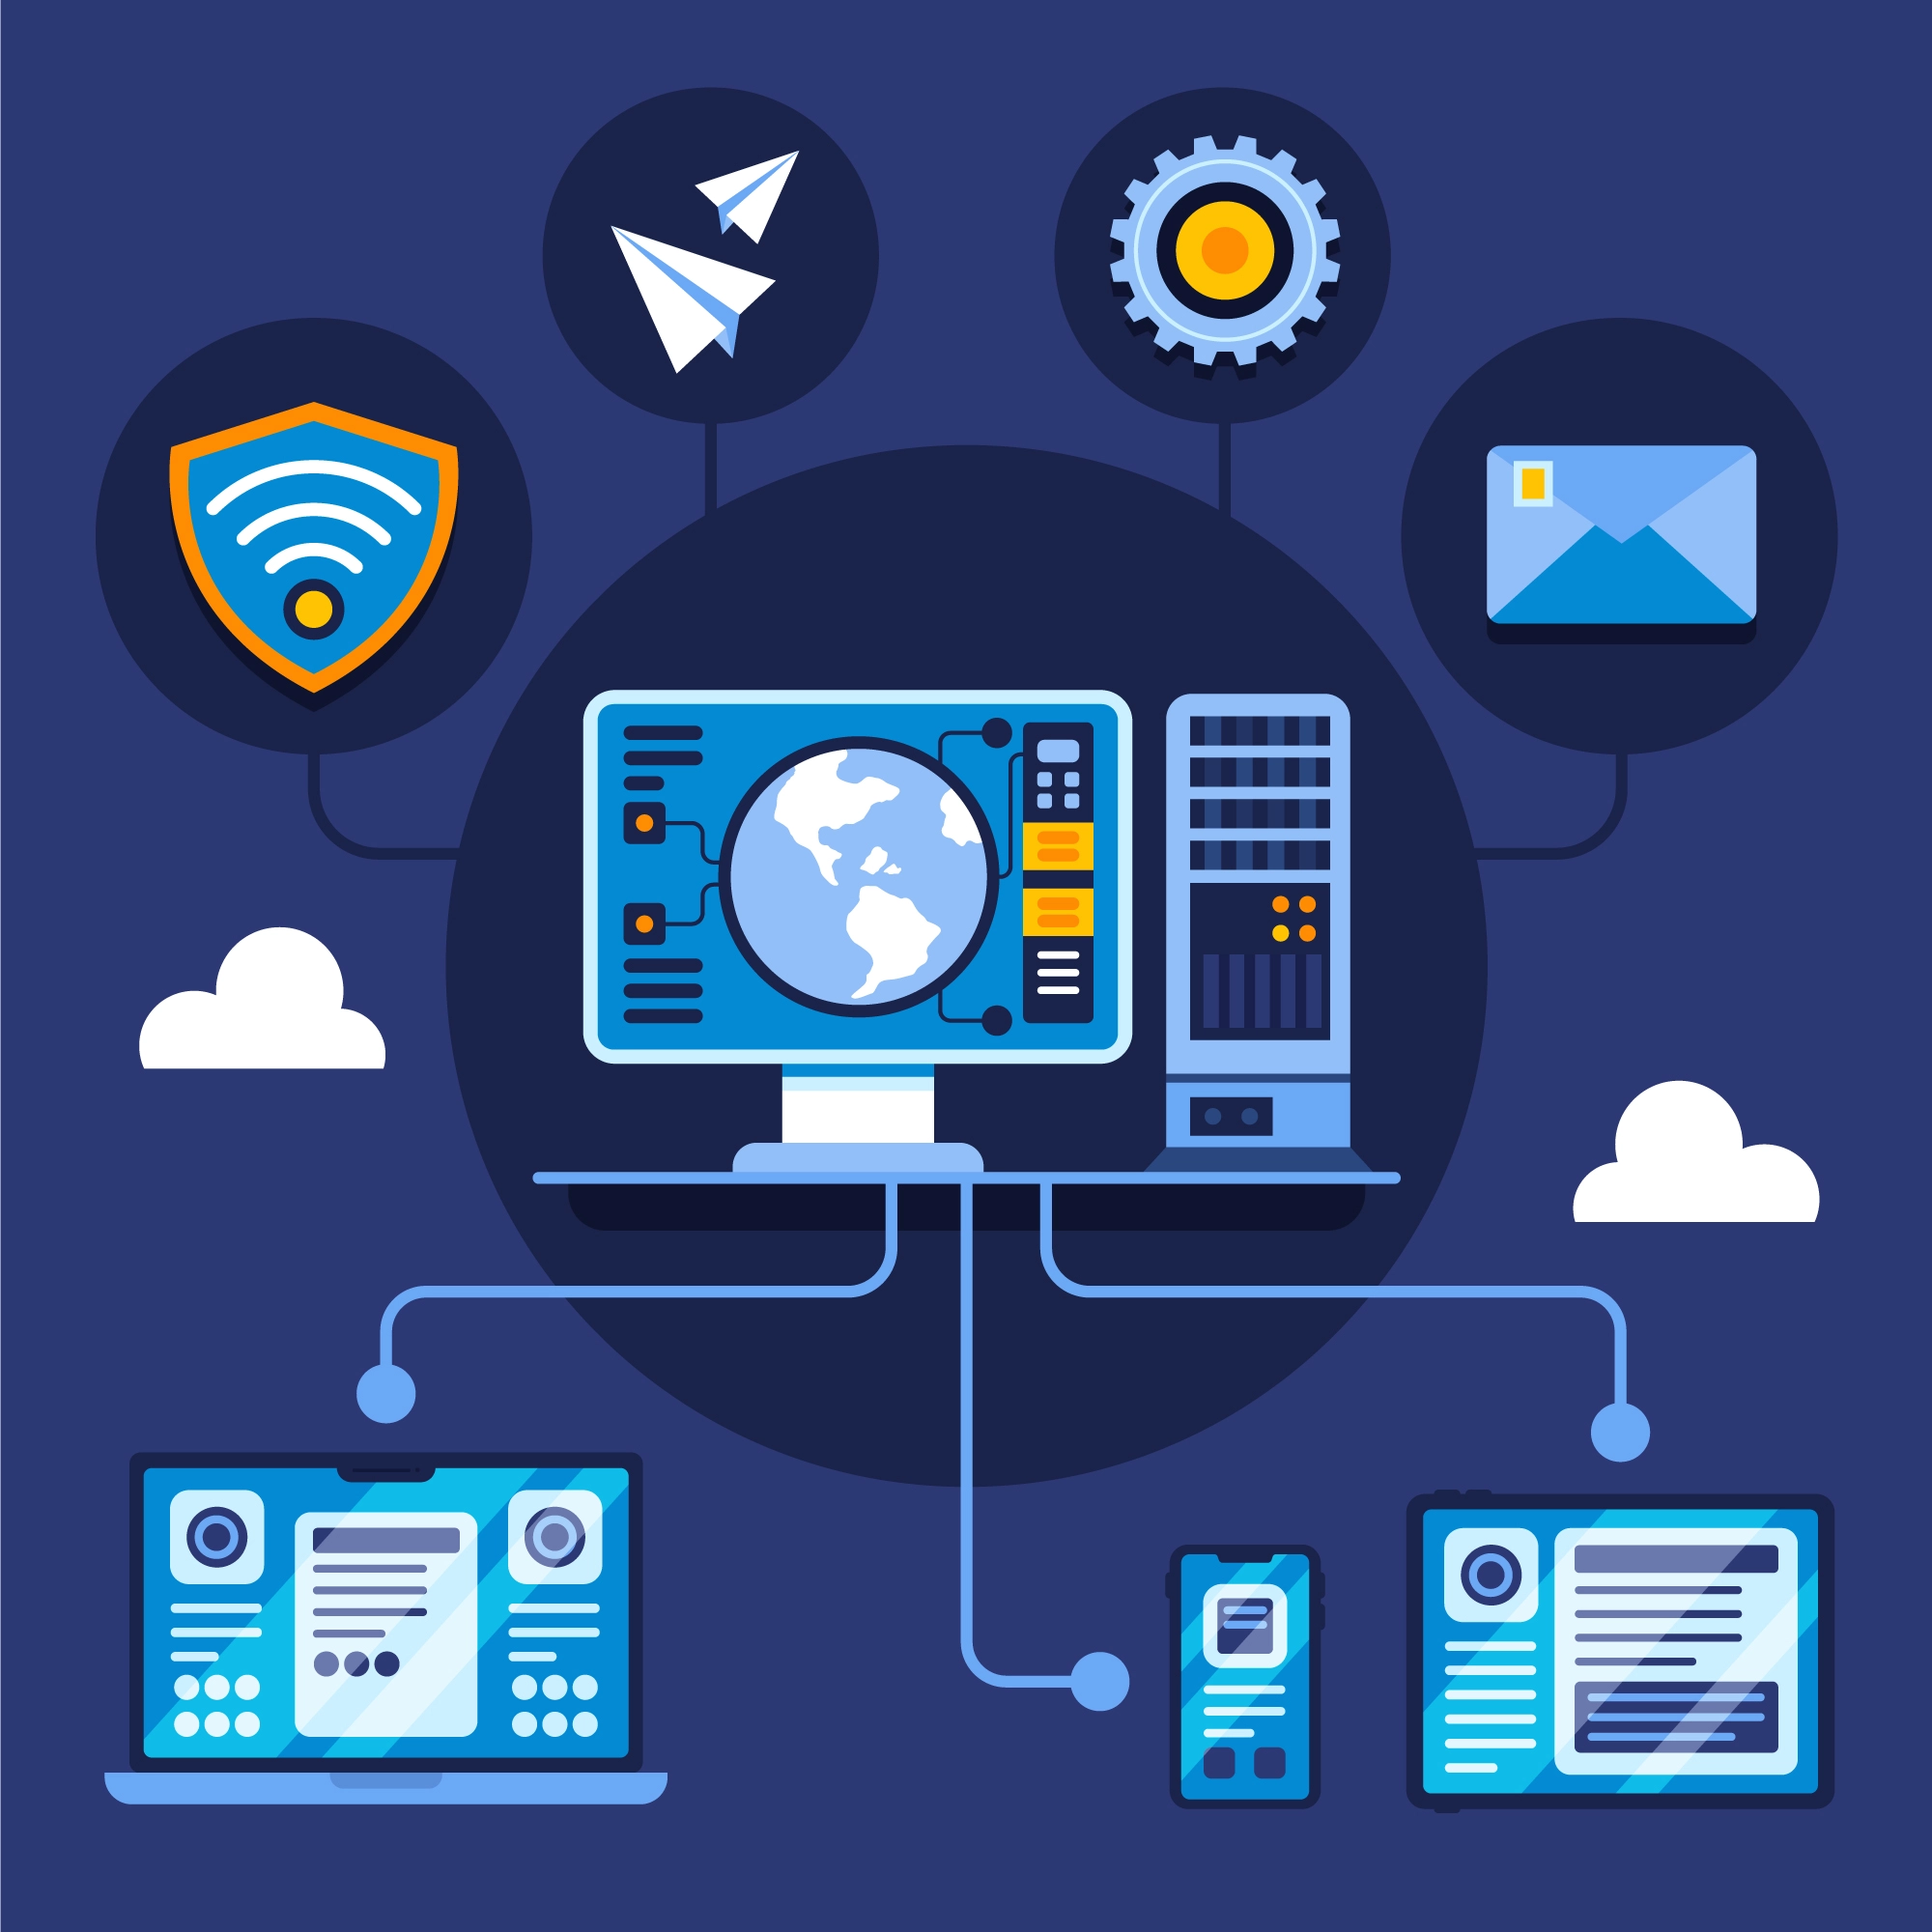
Network Monitoring Tools
Effective network monitoring is critical for any organization. Network outages can bring business operations to a halt, leading to lost revenue and decreased productivity. Having robust network monitoring tools in place can help IT teams quickly identify, diagnose, and resolve Network issues. But not all monitoring tools are created equal. Here are some key requirements to look for when evaluating options.

Comprehensive Data Collection
A network monitoring system should collect extensive data from across the infrastructure. This includes performance metrics on servers, network devices like switches and Routers, and key applications. The system should also track network availability, bandwidth utilization, packet loss rates, and other critical statistics. More data points lead to better insights.
Customizable Alerting and Notifications
The best network monitoring tools allow admins to set customized alert rules and thresholds.
For example, you may want to be notified immediately if a server goes offline but only receive a weekly report on bandwidth usage statistics. Robust tools provide granular control over notifications via email, SMS, and push alerts.
Intuitive Dashboards and Visualizations
Data is useless if it can’t be interpreted. Look for a solution that presents information clearly through customizable dashboards, graphs, top talkers reports, heat maps, and more. Interactive visualizations allow you to spot performance issues and bottlenecks at a glance.
Scalability
As the network grows, the monitoring system should easily scale with it. Cloud-based tools often have an advantage here over on-premises Servers. The system should handle large data loads and additions of network segments without a hitch.
Automated Network Mapping and Inventory
The best tools will automatically map Network Topology and create an inventory of all devices. This gives admins an at-a-glance overview and helps them quickly trace the root cause of issues by seeing upstream/downstream dependencies. Manual documentation of networks can get outdated quickly.
Integrations with Other Stack Systems
Your network monitoring system shouldn’t operate in a silo. Integration with other IT platforms provides more context for issue diagnosis. For example, integrating server monitoring, virtualization management, and helpdesk ticketing tools provides well-rounded infrastructure visibility. APIs also allow for custom integration.
Role-Based Access and Security Controls
In larger organizations, not everyone needs access to the network monitoring system. Look for tools that provide role-based access levels, two-factor authentication, and other security controls to limit exposure of sensitive data. Auditing capabilities should also be available.
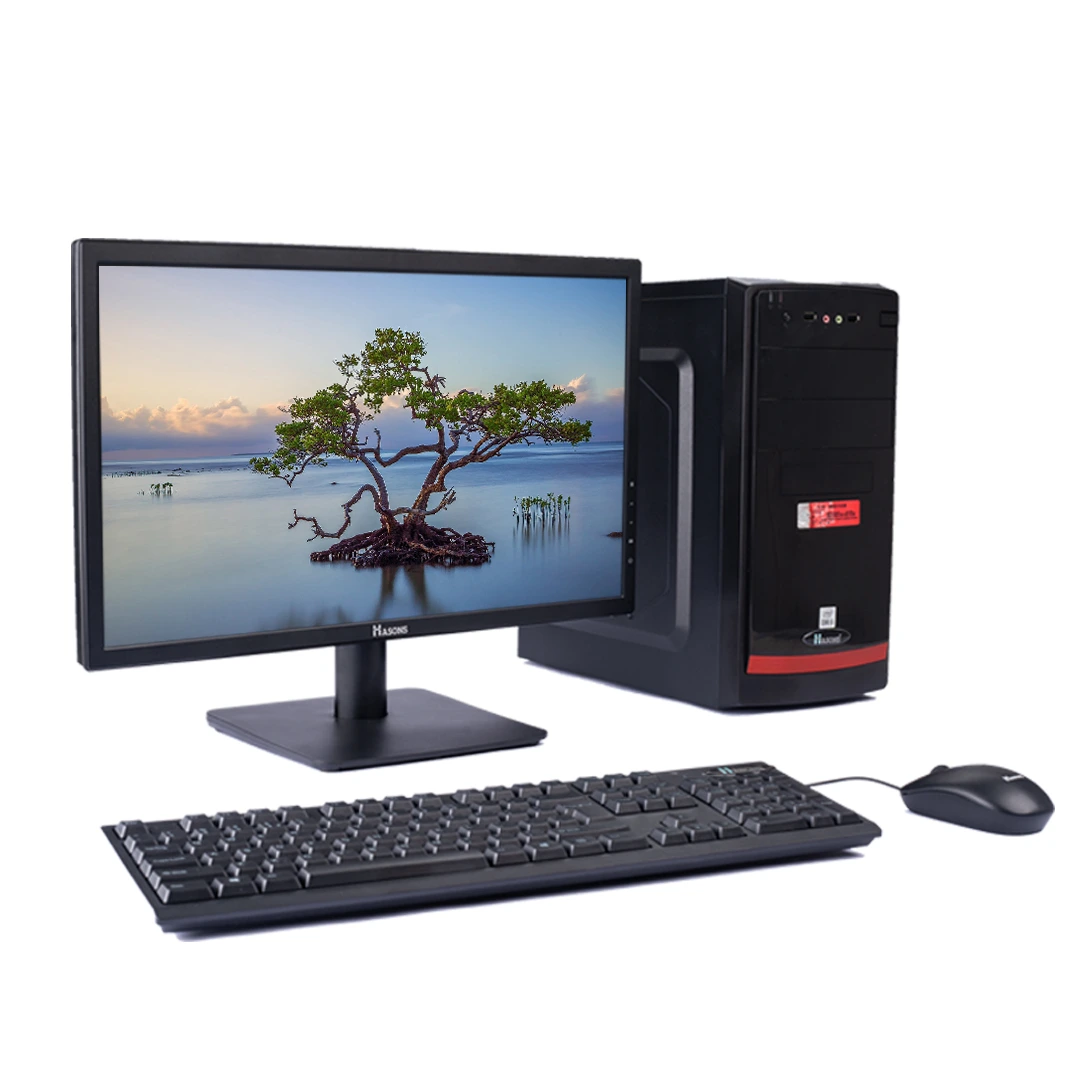
Now, understanding this concept is simple and entertaining for Hasons. Using the Hasons website you can always stay one step ahead in your job, business, or studies by purchasing New Age Desktops and i3 Intel Core Processor Desktop starting from 15000/-. Monitors, CPUs, and Gaming Desktop are also available. Register on Hasons and order your Tech Partner Now. Get exciting offers and benefits on your every purchase. Contact us so our support team can guide you in purchasing the right Tech Partner.
QuantumPower I5R-8GB-1TB Desktop
I5 8gb RAM 1tb HDD Gen 10400/Chipset Series H410 (Windows 10 Pro/1TB HDD/DDR4-8GB /Wired Keyboard, Mouse/ Black), Screen 21.5
Monitoring the status of individual network components is important. But modern tools also allow for automation of certain tasks like adding devices and configuring them consistently. This way, when you plug in a new switch, rules and settings can be applied automatically without manual intervention.
Reporting Capabilities
IT executives often don’t have time to log into a dashboard to check network health. Enable your team to demonstrate their impact through robust reporting capabilities like customizable reports, executive roll-up reports, and reports that highlight SLA successes.
How Network Monitoring Tools Work
Network monitoring tools work by employing agents, APIs, and sniffing traffic patterns. Here is a breakdown:
- Agents: An agent is a small piece of software installed on servers, computers, or network devices to track status and metrics. Data is forwarded to a central collector. Agents use minimal network resources and provide deep visibility since they access info directly from devices.
- APIs: Many modern applications and services provide APIs (application programming interfaces) that allow network monitoring tools to extract data. No agents required. For example, monitoring tools could connect to cloud services like AWS, Azure, or G Suite to access performance metrics.
- Traffic Analysis: Agentless network tools analyze traffic patterns using deep packet inspection. This allows them to calculate bandwidth utilization, identify top talkers, monitor application performance, and more. Useful when you can’t install agents or leverage APIs.
Intelligent algorithms in network monitoring tools make sense of the data flowing in from these sources. Metrics are tracked, anomalies and events trigger alerts, and data visualizations help admins interpret what’s happening across the infrastructure. Combining agent data, APIs, and traffic analysis provides comprehensive monitoring coverage across today’s hybrid environments.

Importance of Network Monitoring
There are several key reasons why network monitoring is vitally important:
- Prevent Outages – Outages disrupt productivity and cause lost revenue. Monitoring tools detect potential issues like high utilization and help prevent crashes.
- Meeting SLAs :- Service level agreements (SLAs) related to network/application uptime, performance, and recovery time can carry stiff penalties. Monitoring is necessary to meet these standards.
- Security :- unusual traffic patterns, bandwidth consumption spikes, and system configuration changes can indicate security breaches. Quickly detecting anomalies improves security.
- Optimized efficiency :- Identifying over/under utilized links and redundant systems allows for better allocation of resources. Monitoring uncovers optimization opportunities.
- Regulatory compliance :- Many regulations like HIPAA and PCI require extensive network monitoring, auditing, and reporting to ensure standards are met.
- Planning :- Data insights gathered over time through monitoring tools facilitate more accurate growth planning and infrastructure budgeting.
Without monitoring, IT teams operate blindly. Network monitoring provides the visibility required to minimize business disruptions, improve security, optimize efficiency, and plan for the future.
Primary Factors to Consider While Monitoring Network
Effective network monitoring is a multifaceted endeavor that requires careful consideration of various factors to ensure comprehensive visibility, optimal performance, and efficient resource utilization. Here are some primary factors that organizations should consider while monitoring their networks:
Network Topology and Architecture: Understanding the topology and architecture of your network is crucial for identifying critical monitoring points and ensuring comprehensive coverage. This includes mapping out network devices, servers, applications, and their interdependencies to establish a holistic monitoring strategy.
Business Criticality and Service-Level Agreements (SLAs): Different components of your network may have varying levels of criticality based on their impact on business operations and customer experience. Monitoring efforts should be prioritized based on these criticalities, with more stringent monitoring applied to mission-critical components and services governed by SLAs.
Security and Compliance Requirements: Network monitoring plays a vital role in maintaining a robust security posture and ensuring compliance with industry regulations and standards. Organizations should incorporate security monitoring, threat detection, and compliance reporting into their overall monitoring strategy.
Network Traffic Patterns and Usage: Understanding network traffic patterns and usage trends can help optimize monitoring intervals, identify potential bottlenecks, and proactively address capacity constraints. This may involve monitoring bandwidth utilization, application traffic, and user activity patterns.
Performance Baselines and Historical Data: Establishing performance baselines and leveraging historical data can provide valuable insights into normal versus abnormal behavior, enabling more accurate threshold setting and proactive issue identification.
Scalability and Future Growth: As networks evolve and expand, the monitoring strategy should be designed with scalability in mind. This includes considering the ability to add new monitoring points, integrate with emerging technologies, and accommodate future growth without compromising visibility or performance.
Monitoring Tool Capabilities and Integration: The capabilities and limitations of the chosen monitoring tools should be carefully evaluated to ensure they align with the organization’s monitoring requirements. Additionally, seamless integration with existing systems and processes is essential for efficient data collection, analysis, and reporting.
Resource Utilization and Cost: Effective network monitoring should strike a balance between comprehensive visibility and efficient resource utilization. Organizations should consider the resource requirements (CPU, memory, storage, bandwidth) of their monitoring strategy and weigh them against the associated costs and potential benefits.
By taking these factors into account, organizations can develop a tailored network monitoring strategy that aligns with their specific needs, priorities, and constraints, enabling proactive issue identification, optimal performance, and efficient resource management.
Categorization of Network Monitoring
Network monitoring tools can be categorized based on deployment method, scope, and metrics monitored:
- Infrastructure Monitoring:- Tracks availability and utilization of physical/virtual network infrastructure components like routers, switches, servers, load balancers and more.
- Application Monitoring :- Focuses exclusively on monitoring availability and performance of critical business applications and services.
- Network Packet Brokers :- Specialized tools that manage and monitor traffic flowing across networks. Useful for Security, forensic analysis, and selective data routing.
Metrics Tracked
- Availability Monitoring:– Tracks uptime and connectivity of infrastructure and apps.
- Performance Monitoring:- Analyzes bandwidth utilization, throughput, and latency.
- Traffic Analysis:- Inspects patterns for security events, capacity issues, and more.
- Log Analysis:- Parses log data for info like errors, access attempts, crashes, changes.
- Configuration Monitoring:- Detects changes to device configs and settings.
As you can see, network monitoring is a broad term that encompasses tools focused on various deployment methods, scopes, and metrics. Understanding these subtleties helps match specific business needs to the appropriate monitoring approach.
How to Choose a Network Monitoring Tool
With an abundance of solutions on the market, choosing a network monitoring system can feel overwhelming. Follow these tips to narrow your search:
- Identify Primary Use Case
Get stakeholder feedback to rank the most important monitoring needs – is it deep infrastructure visibility, public cloud oversight, application performance, traffic analysis for security, or a combination? This informs tool criteria. - Consider Scalability
Assess how needs may evolve over the next several years based on business plans. Map out growth requirements and ensure monitoring can scale accordingly. Cloud solutions are often more scalable than on-premises. - Verify Platform and Integration Support
Make sure platforms like Windows, Linux, hypervisor environments, public clouds, containers, and software-defined infrastructure are all supported. API integration capabilities are also key for tying data together from other Systems. - Evaluate Ease of Use
Solutions like Cisco, SolarWinds, Paessler and ManageEngine vary greatly in terms of interface intuitiveness, auto-discovery capabilities, pre-configured dashboards, and role-based access control. Choose a tool aligned with the team’s technical proficiency. - Run a Proof of Concept
Leverage free trials or test environments to validate reporting, visualization & analytical abilities meet stakeholder expectations before purchasing. Hands-on experience also evaluates tool flexibility.
Monitoring Network and App Performance
While tracking basic uptime is expected, modern networks live and die based on application and infrastructure performance. According to SolarWinds 2020 IT Trends Report, 50% of tech pro’s time is spent monitoring application health and triaging issues. Robust tools provide visibility into key performance metrics:
- Infrastructure Response Time: Latency, jitter, and packet loss metrics indicate how well infrastructure components like WAN links and routers are supporting traffic loads. Monitoring these KPIs help diagnose developing issues before users notice.
- Application Response Time: Tracking response time and requests per second provide insight on overall app health from an end user perspective. Broken down by app function or code level, this helps isolate problem modules during times of poor performance.
- Bandwidth Utilization: Network admins must ensure critical business applications and services have the dedicated bandwidth resources needed during peak usage times. Monitoring utilization across links provides data to optimize network priorities and capacity.
- Throughput Rates: Volume metrics indicate how much data is flowing across network segments and infrastructure components. Irregular throughput levels can signal developing issues and bottlenecks.
- Connection Status: Tracking the number of concurrent Application connections along with connects and disconnects points helps managers gauge activity levels and scale out software based on usage patterns.
- Error Rates: Applications can experience transient errors or more serious crashes/failures. Monitoring error rates and response codes provides early warning for potential app issues.
Detailed metrics empower IT teams to set better performance baselines, fine-tune configurations, isolate problems faster, and deliver a robust user experience.
| If you are reading Network Monitoring Tools then also check our other blogs: | |
| Computer Virus | First Electronic Computer |
Network Monitoring Tools
- What are network monitoring tools?Network monitoring tools encompass software and hardware solutions that track the availability, utilization, performance, and overall health of infrastructure components, applications, traffic flows, and security events across private and public cloud environments. Robust monitoring improves uptime, security, efficiency, and capacity planning.
- Why are network monitoring tools used?Monitoring tools are necessities - not luxuries - for modern IT environments. High network & application availability is essential given that most businesses rely on digital systems and online access to drive key functions. Detailed performance metrics enable capacity planning and optimization. Traffic monitoring improves threat detection. Monitoring helps IT demonstrate infrastructure & app value to business leaders.
- How do network monitoring tools work?Network monitoring leverages agents installed locally on devices, integrations with element managers & public cloud control planes via APIs, and agentless traffic flow analysis. Data feeds are aggregated, correlated, analyzed, and visualized through machine learning-enhanced analytics. Alerts trigger based on configurable threshold & event policies. Role-based access displays relevant views for each stakeholder.

