GPU Benchmarks and Hierarchy 2024
The GPU (Graphics Processing Unit) market saw some major developments in 2022 and early 2023, with new launches from both AMD and Nvidia. In this blog, we will analyze the latest GPU benchmarks and look at the updated GPU hierarchy based on real-world gaming performance in 2024.
GPU Benchmark Ranking 2024
GPU benchmark results help us rank graphics cards based on their actual performance instead of just their specs. There are both synthetic benchmarks as well as benchmarks in popular games that stress the GPU in different ways.

Looking at benchmarks across a variety of games and resolutions gives us a realistic picture of expected gaming performance with different GPUs. Here are some of the key benchmark results:
Key Rasterization Benchmark Results, Key Takeaways
- At 1080p, many mid-range cards like the RTX 3060 are very capable, producing over 60 FPS in most games. High-end cards can push frame rates up to 240 FPS.
- 1440p is now well within the reach of most modern GPUs. The mid-range RTX 3070 and RX 6800 provide a smooth 60+ FPS experience.
- Top-end cards like the 3080 Ti and 6950 XT excel at 4K, with many games breaking the 60 FPS barrier at max settings.
So we see significant upgrades across all tiers of graphics cards in rasterization performance. Higher resolutions are more mainstream, allowing more gamers to enjoy sharp image quality up to 4K without compromising frame rates.
Ray Tracing GPU Benchmarks Ranking 2024
Ray tracing is an advanced lighting technique that greatly enhances visual quality, but also hits frame rates hard. Let’s see how the GPU hierarchy for ray tracing performance shapes up in 2024 based on benchmarks in games like Cyberpunk 2077.
Nvidia clearly leads AMD in ray tracing performance. Key observations:
- At 1440p, the RTX 3070 delivers just over 60 FPS average with full ray tracing enabled in Cyberpunk 2077. So it marks the entry point for smooth 60 FPS ray traced gaming.
- Higher-end 3000 series cards like the RTX 3080 and 3090 can do 1440p and 4K with ray tracing at very respectable frame rates.
So team green maintains its advantage in ray tracing. Only its high-end cards manage playable frame rates with full ray tracing right now. Ampere GPUs deliver significantly better efficiency than Turing for ray tracing workloads due to the improved RT cores.
Tom’s Hardware Ray Tracing GPU Benchmark Hierarchy
Tom’s Hardware has an in-depth ray tracing GPU benchmark hierachy covering cards across the spectrum. Here is how the graphics cards stack up:

- For 1080p ray tracing, the 6700 XT provides adequate performance, but the RTX 3070 marks a real sweetspot of 60+ FPS.
- At 1440p, only high-end cards like the RTX 3080 Ti and above can manage 60 FPS consistently across a variety of ray traced games.
- Top-tier cards like the RTX 3090, 3090 Ti, and 6950 XT trade blows for the ultimate 4K ray tracing experience at the moment.
So for premium ray traced visuals Nvidia continues to deliver tangibly better performance in 2024 thanks to its superior dedicated hardware for ray tracing workloads.
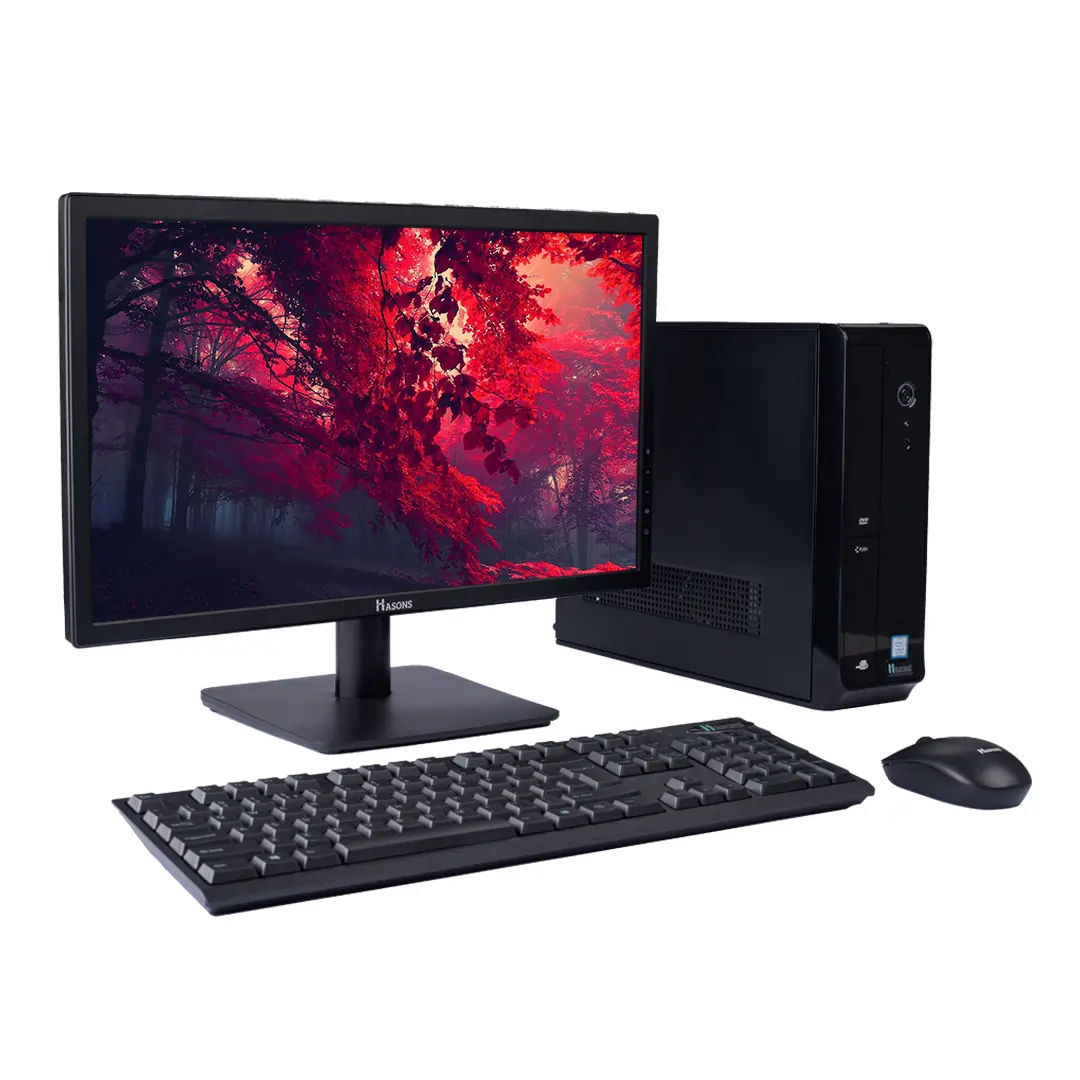
Now, understanding this concept is simple and entertaining for Hasons. Using the Hason website you can always stay one step ahead in your job, business, or studies by purchasing New Age Desktops and All in One Desktops, i3 Intel Core Processor Desktop starting from 15000/-. Monitors, CPUs, and Gaming Desktop are also available. Register on Hasons and order your Tech Partner Now. Get exciting offers and benefits on your every purchase. Contact us so our support team can guide you in purchasing the right Tech Partner.

core i3 desktop 6th Gen | RAM 4 GB | 500 GB HDD | 128 GB SSD | H110 Motherboard Chipset | 18.5 Inch Screen | Desktop Set
Call 9766122859 to place an offline order and receive FLAT 500/- DISCOUNT
Conclusion
The GPU landscape saw some exciting developments shaped by new high-end and mid-range releases from AMD and Nvidia over the past year. Updated rasterization and ray tracing benchmarks help us clearly see the graphics card performance hierarchy in 2024 for gaming.
Nvidia retains its performance advantage in ray tracing, while offering very capable cards across other price segments as well. But AMD is fully competitive in raw rasterization muscle at various levels.
For 1080p gaming even some mid-range options like the RTX 3060 deliver very high frame rates. 1440p gaming is quite mainstream now, with a smooth 60 FPS experience in reach for many gamers even with visual settings maxed out. Top offerings from both AMD and Nvidia shine in 4K now.
Ray tracing frame rates have also improved substantially courtesy of the upgraded hardware. So a new level of visual fidelity is accessible in many titles if you have the right card.
We hope you enjoyed this deep dive into where GPU performance currently stands based on all the latest gaming benchmarks across resolutions and use cases. Let us know your take on the GPU landscape of 2024!
| For updates in the GPU Benchmark and Hierachy, read Hasons news. Some of them are as follows: | ||
| The Talent Implications of Generative AI | Artificial Intelligence | |
| Microsoft News | Zoom Apps new Features | |
GPU Benchmarks and Hierarchy 2024: Graphics Cards Ranked
- What are GPU benchmarks?GPU benchmarks are tests or measurements conducted to assess the performance of a graphics processing unit (GPU). They are used to evaluate and compare the capabilities of different GPUs, including their computational power, graphics rendering capabilities, and overall efficiency.
- Why are GPU benchmarks important?GPU benchmarks are important for several reasons:
- Performance Evaluation: GPU benchmarks provide an objective measure of a GPU's performance. They help users understand how well a GPU performs in various tasks such as gaming, 3D rendering, video editing, scientific computations, and machine learning. By comparing benchmark scores, users can make informed decisions when choosing a GPU that meets their specific needs.
- Hardware Comparison: GPU benchmarks allow for a direct comparison between different GPU models or brands. They provide a standardized metric to assess the relative performance of GPUs, helping users identify which GPUs offer better value for their specific requirements and budget.
- What aspects are typically measured in GPU benchmarks?GPU benchmarks measure various aspects of a graphics processing unit (GPU) to assess its performance. Some of the common aspects measured in GPU benchmarks include:
- Graphics Performance: This aspect focuses on the GPU's ability to render and display graphics. It measures parameters such as frame rates (the number of frames per second), rendering quality, and visual effects. Graphics benchmarks often involve running demanding games or 3D graphics simulations to evaluate the GPU's performance in real-world scenarios.
- Compute Performance: Compute performance measures the GPU's ability to perform general-purpose computational tasks. It assesses the GPU's processing power for tasks like scientific computations, data analysis, artificial intelligence, and cryptocurrency mining. Compute benchmarks typically use specific algorithms or simulations to stress the GPU's computational capabilities.
- Memory Performance: GPU benchmarks may also evaluate the performance of the GPU's memory subsystem. This includes memory bandwidth, latency, and capacity. Memory benchmarks assess how efficiently the GPU can read from and write to its memory, which can impact overall performance, especially in memory-intensive applications.
- How are GPUs ranked in a hierarchy?GPUs are ranked in a hierarchy based on their performance and capabilities. The hierarchy provides a relative comparison of different GPUs, with higher-ranked GPUs offering better performance than lower-ranked ones. Here are some key points about GPU hierarchy ranking:
- Benchmark Scores: GPU hierarchy rankings are often based on benchmark scores obtained from various GPU performance tests. These benchmarks measure factors such as graphics performance, compute performance, and memory performance. Higher benchmark scores indicate superior performance and result in a higher rank within the hierarchy.
- Comparison Across Models: GPUs from different manufacturers and product lines can be ranked in a hierarchy by comparing their benchmark scores. For example, NVIDIA GeForce and AMD Radeon GPUs are commonly ranked against each other. Additionally, within a manufacturer's product line, GPUs with higher model numbers or more advanced architectures tend to have higher rankings.
- Performance Tiers: GPU hierarchy rankings are often organized into performance tiers. The tiers categorize GPUs into different levels based on their overall performance. The specific tier names may vary depending on the source, but they generally indicate the relative performance level of the GPUs.
